A better way to monitor and debug your Postgres database
Get real-time health dashboards, query insights, dynamic recommendations and more.

In-depth metric dashboards to visualize Postgres health
Pre-built dashboards for connections, PgBouncer, database cache, tables and indexes.
Monitor server health through load avg, IOPS, memory and disk usage.
Track replica health and replication lag metrics.
Unlock and visualize metrics that are often buried in noisy logs.
Load Average
The average system load on your server divided by number of CPUs

Dig into individual queries and troubleshoot database usage
See automatic EXPLAIN plans for your slowest queries.
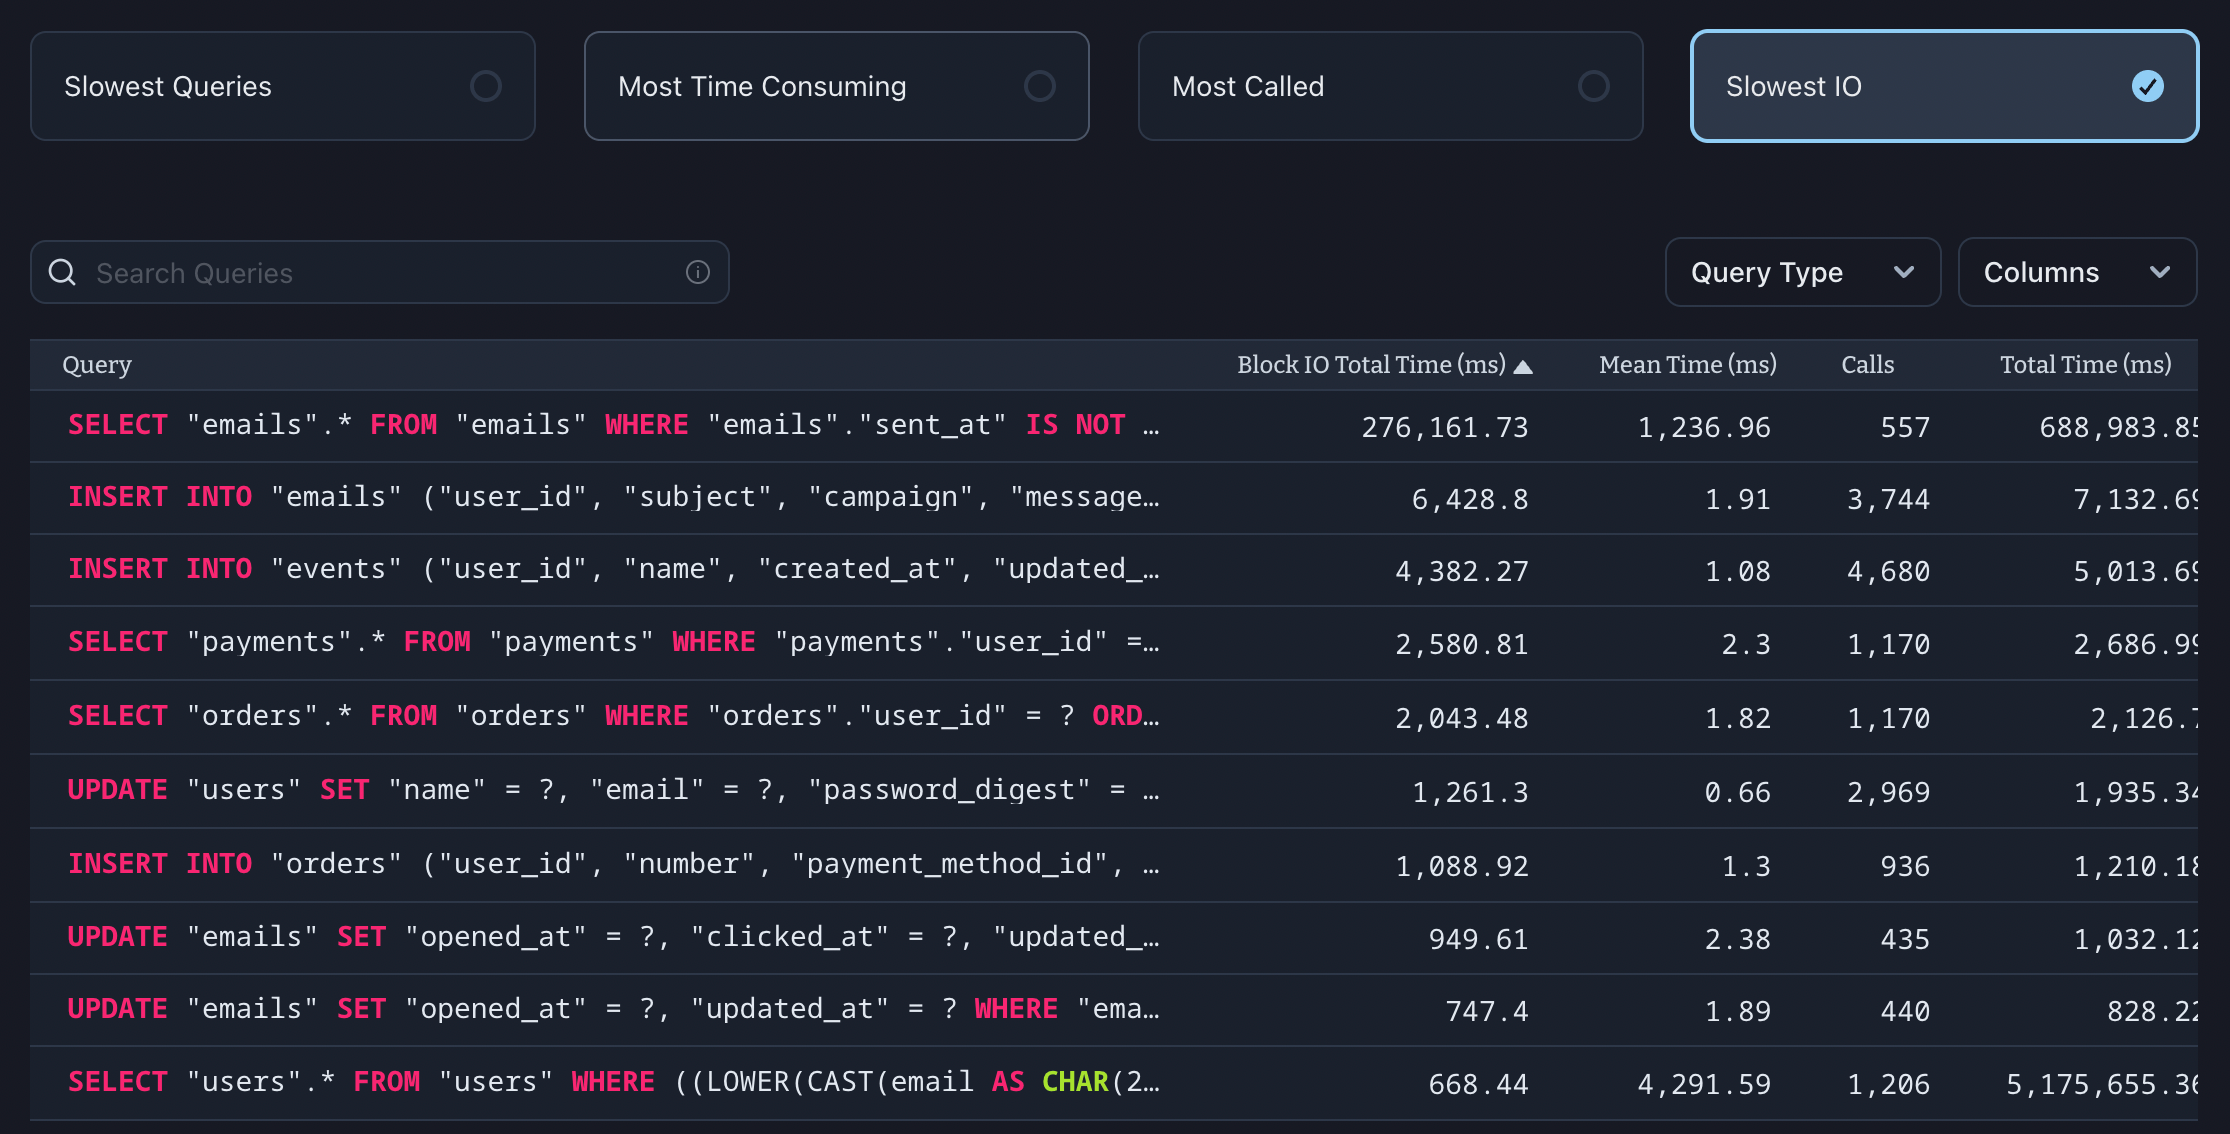
Identify your slowest, most time consuming, most called, and slowest IO queries.
Explore historical aggregated statistics from pg_stat_statements for queries.
PII and any other sensitive data is always scrubbed and redacted.
Get personalized, dynamic recommendations about your database
We automatically detect opportunities to free up disk space and improve performance.
Understand when table scans, low cache hit rates or bloat impact your tables and queries.
Easily take action on unused, redundant or invalid indexes.
Get clear explanations of common issues and how to remedy them.
##
##
##
Explore table & index schemas
See when tables and indexes were built along with their current state.
Track bloat, scans, cache hit % and more on every table and index.
Visually compare your largest tables and indexes by disk size and row count.
See all table definitions and index columns for your database.
Receive alerts before a problem surfaces to your users
Use Smart Alerts to automatically monitor your database for common issues.
Set custom metric alerts for the specific pain points you care about.
Detect warning signs before they become an issue in production.
Receive alerts via Slack, PagerDuty, email or webhook.
Pricing
Pay as you grow
Only pay for what you need. Our core features are available in every plan.
Startup Plan
$
39
/ mo
- 1 monitored server
- 30 day data retention
Enterprise Plan
$
79
/ mo
- 1 monitored server
- 90 day data retention
- Priority customer support
Included in all plans
Server health dashboards
Dynamic recommendations
Query stats (slowest, most called, disk IO, etc)
Slow queries and EXPLAIN plans
Table & index schema monitoring
Alerts coming soon!
Leave us feedback
How can we do better?
We care deeply about improving our product. Please let us know if you have any feedback or questions for us.
This website uses cookies to enhance the user experience. View our Privacy Policy